- Features by Edition
- Latest Features
- Licensing/Activation
- Installation
- Getting Started
- Data Sources
- Deployment/Publishing
- Server Topics
- Integration Topics
- Scaling/Performance
- Reference
- Specifications
- Video Tutorials and Reference
- Featured Videos
- Demos and screenshots
- Online Error Report
- Support
- Legal-Small Print
- Why Omniscope?
|
|
|
|||||
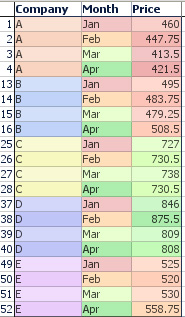
Time SeriesTime Series Data LayoutDisplaying time series in OmniscopeOmniscope makes use of repeated observations over time in vertical rows, rather than the horizontal column layouts often used to lay out spreadsheets. To create a multi-line time series in Omniscope, put your data in a 'vertical' format like that illustrated below, where each successive record in the data file is a price observation for a company's shares at a different point in time:
Check your data types - After importing your data, make sure the Time (here Month) and Value (here Price) fields are the correct format. They must be numeric (decimal or integer), or dates, shown by the red to green colour gradation. Also make sure the Category field is of type Category, shown by the variety of different colours. You can convert data from one type to the other by right-clicking the column header in the Table View and choosing Convert field data type. My data goes the other way!Sometimes time series source data is laid out horizontally (repeated observations in columns) when Omniscope would manage it better vertically. In other cases, data may need to be exported from Omniscope in an orientation different from that used in the Omniscope file. To avoid the time consuming process of changing the orientation of some or all of the data from horizontal to vertical (row becomes column) or vertical to horizontal (column becomes row), Omniscope has both De-pivot and Re-pivot functions. Use of these functions is discussed here.
For a continuation on displaying line graphs like time series, see the the Graph View section displaying time series.
|