- Features by Edition
- Latest Features
- Licensing/Activation
- Installation
- Getting Started
- Data Sources
- Deployment/Publishing
- Server Topics
- Integration Topics
- Scaling/Performance
- Reference
- Specifications
- Video Tutorials and Reference
- Featured Videos
- Demos and screenshots
- Online Error Report
- Support
- Legal-Small Print
- Why Omniscope?
|
|
|
|||||
Placing MarkersPlacing Map MarkersAdding & Editing Map Coordinates ManuallyYou can use embedded vector maps or online Google Maps from within Omniscope to add map coordinates to your data by selecting records (rows) and manually placing markers on an open Map View. 1. Open File and Add ViewsTo place markers and automatically generate coordinates in your data for existing records (rows), open your data set and close all open views except:
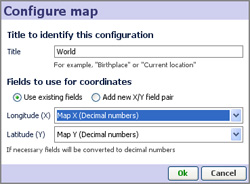
These views must be open simultaneously, and you might want to drag or switch (rotate) the view divider to allocate more space to the Map View. When you add the Map View, if this is the first time you're adding markers to the map, you will see the Configure Map dialog asking you to configure the map:
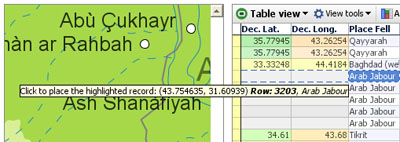
Make sure Add new X/Y field pair is selected, and click OK. You will be able to name the new. blank coordinate fields in the dialog. 2. Filter the dataNext, filter your data until only the records you want to place to generate coordinates remain visible. For example, if you have already placed some markers, you will want to filter out the records that already have coordinates. This will make focusing on the remaining records with blank coordinates easier. In the Omniscope Table view, scroll across to the coordinate fields, and click on any grey (blank) cell. This will select all the records without coordinates. Click Keep on the Main Toolbar to isolate only those records in the Table View. 3. Placing a single recordIn the Map View, first make sure Place marker mode is selected in the mouse Mode drop-down.
Notice that the X and Y coordinate fields visible in the Table View are populated automatically with latitude and longitude coordinates when you do this. 4. Placing multiple recordsSometimes you might want to place a range of records at a single point on the map. For example, you might have a database of customers, and you might only know they are based in London. In the Table or Chart Views, select the records you want to place in the same location. In our example, there might be a field called 'Location'. In the Chart View, we would open the Location device and select the value 'London'. In the Map View again, still in Place marker mode, point at London and click to place all selected markers in London. 5. Moving existing markersAfter zooming in and exploring your map and markers, you might want to adjust the position of some of them. In Place marker mode, dragging a marker will update its position. If the marker represents several records, only the top-most record in the "pile" will be repositioned. 6. Adding new recordsWhen in Place marker mode, if you click on the map without record(s) selected/highlighted, you will be asked if you want to Add a record at that location. This will create a new record (row) in the data set, with all fields empty except the coordinates.
|