- Features by Edition
- Latest Features
- Licensing/Activation
- Installation
- Getting Started
- Data Sources
- Deployment/Publishing
- Server Topics
- Integration Topics
- Scaling/Performance
- Reference
- Guide to Views
- Keyboard Shortcuts
- Dates & Times
- Manage Fields
- Tokenised Data
- Using Formulae
- Scripting
- Mapping & GIS
- Advertising Options
- Legacy User Guide
- Translation Guide
- Specifications
- Video Tutorials and Reference
- Featured Videos
- Demos and screenshots
- Online Error Report
- Support
- Legal-Small Print
- Why Omniscope?
|
|
|
|||||
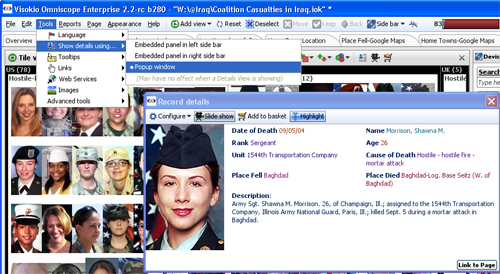
Displaying Details (2.4)Displaying Details (2.4)Visual display of individual records (rows)Applies only to version 2.4; With the exception of the Table View, Omniscope views do not show the all the values associated with individual records (rows) or small groups of records. Once you have filtered down to a relatively small group of records of interest (using Selections followed by Moves and Keeps, instant Sidebar filter devices, or selecting a Named Query data subset) you have several highly-configurable options for viewing some or all of the details for one or a group of selected records. Details View and pop-up window for single recordsIf the Table View is open, and no Details View is open, selecting/double clicking on a row header (left-most part of a row) will display the details for that record- either as a separate pop-up window (the Details window) or as an embedded panel in the left or right Sidebar (you set this option from Main Toolbar: Tools > Show details using ).
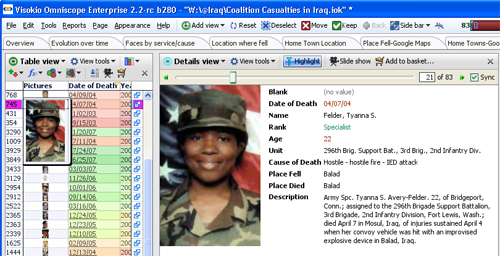
Viewing Details for multiple recordsEvery View Toolbar has a View Details icon next to the Add to Basket icon on the right hand side. This command opens a tabular view of either the selected records in the view, or all data in the view, showing the fields set to be visible in the Table View, even if the Table View is not visible. The View Details option is like opening a temporary Table View. Like the Table View, double clicking on the row header, or on any underlined link set to open the Details Window/Side Bar panel, will display individual details for that record. You are always at most 2 clicks away from full details on any record using the View Details option on any View Toolbar, followed by clicking on the row header or details link in the View Details pop-up window.
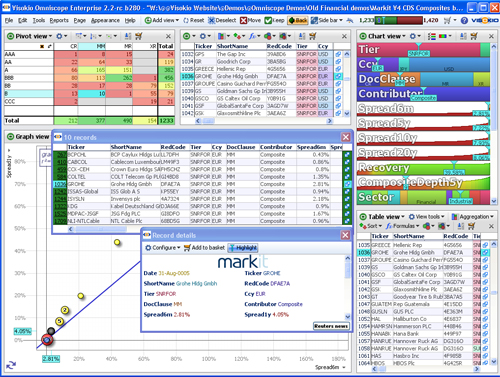
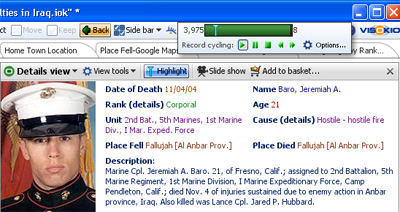
Warning: The fields (columns) displayed in the View Details pop-up table window are the same (and in the same order) as the settings governing the Table View. For an given tab, you must configure a Table View (even if the Table View is not normally open on the Reports Page), in order to control the order of the visible fields in the View Details pop-up for that tab. If you do not do this, the settings for the Table View at the time the tab was created will be used. If you later change the settings for your working display Table View, the changes will not automatically be made in other tabs unless you select Apply these changes to all Table Views and then explicitly elect to apply the same settings to all tabs, or else you return to each tab and change the Table View settings individually. Highlighting (2.3)If Settings > This tab > Brushing enabled (the fading of unselected records) is not enabled, whenever a single record is selected, the position of that record is highlighted in aqua-blue in all open views., as shown above. Open Table Views will scroll to reveal the selected record. Use highlighting to see the positioning of a record in plots, such as the Graph and Chart Views, and read off values for various fields of the selected record in all open views. If you are using a colour-by setting on the Sidebar, highlighted rows will be partially highlighted, so that you can still discern the colour assigned to the highlighted record (row). You can turn this feature off by clearing the Highlight button on the view/pop-up toolbar. Record Cycling (2.3)Hovering on the Main Toolbar barometer reveals the control panel for record cycling. Record cycling automatically steps through the records in the universe you select and displays the position of each record in all open views using highlighting. If you have a Details View open, or details windows showing on the Side Bars, then the details for each record (including any related images) will be displayed as cycling steps through. Cycling is turned on, paused, stopped, fast-forwarded and fast-reversed using the green control icons under the barometer.
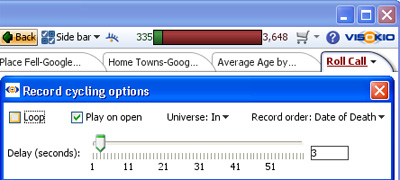
Clicking on the Options button displays the record cycling configuration panel. Options available include Loop, which plays the cycle continuously once started; Play on open, which starts cycling automatically when the file is opened; Universe: which selects the data universe from which the records will be cycled for display; and Record order which sets the field used to order/sort the records to be displayed.
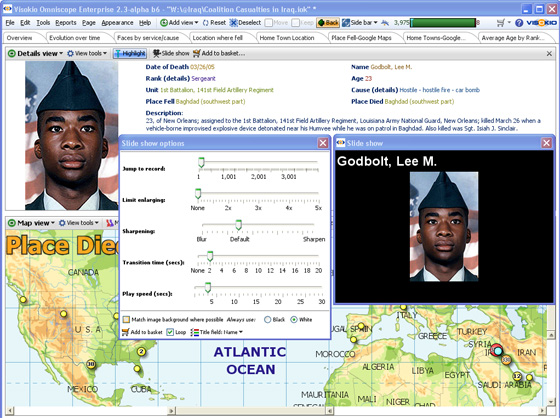
Warning: If you have global record cycling enabled, and you turn off the Highlighting option, the record cycling will stop. To re-start record cycling, hover your mouse on the barometer to expose the global automatic record cycling menu, and click on the green forward arrow to re-start. Note: Version 2.4 has improved control of cycling options, see using the Cycling Toolbar Slide Shows (2.3)Most View Toolbars feature a Slide show option. This option is used in files with associated or embedded image sets to display the image(s) associated with each record in a special Slide show display window. This window can be any size and can be displayed on another monitor. Unlike record cycling with the details view, slide shows can show multiple images associated with each record using tokenized file names in the picture column. For more information, see Tokenized data
From the View Toolbar, click on the Slide show icon to reveal the configuration options panel. Options available on this panel include:
|