- Features by Edition
- Latest Features
- Licensing/Activation
- Installation
- Getting Started
- Data Sources
- Deployment/Publishing
- Server Topics
- Integration Topics
- Scaling/Performance
- Reference
- Specifications
- Video Tutorials and Reference
- Featured Videos
- Demos and screenshots
- Online Error Report
- Support
- Legal-Small Print
- Why Omniscope?
|
|
|
|||||
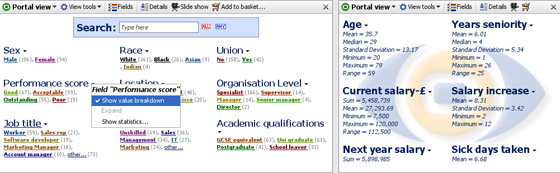
Portal ViewUsing the Portal ViewThe Portal View summarises most aspects of the data set (it can search but does not display text fields) as either field (column) value breakdowns (left example below), or statistics (right example below), or a mix of both. The optional search box works like a search engine across the entire data set, and the dynamically-generated range breakdowns can be selected for use in power queries using the Move, Keep and Reset commands.
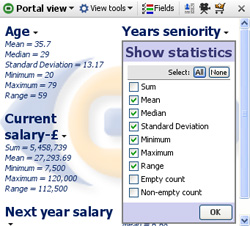
Portal View ControlsThe Portal View features a global Search Box used to select text string values from anywhere in the data set. This is equivalent to the 'Search all' filter device available on the Side Bars. Selection is done by typing into the keyword box (hits are shown in the preview counter on the far right as each character is typed. Multiple words can be entered and the 'and/or' relationship set using the 'ALL' and 'ANY' buttons to the right of the text search box ('ALL' is the default). Note: there is not currently an 'EXACT' option for use with numbers, etc. The Search Box can be used in conjunction with the individual fields in the Portal View by entering text in the Search Box and selecting one or more value ranges within the view. The keyword 'hits' will be displayed in the Search Box while the overall number of hits (text and other values) will be shown by the blue preview bar inside the green barometer on the Main Toolbar. Note: the blue preview bar is only visible when selections are made. Any combination of text string input and multiple field range criteria can be selected and used to execute power queries using the Move and Keep commands on the Main Toolbar. The Search Box can also be used very effectively in conjunction with other views, such as the Table or Details Views set to display the SELECTION universe. Field Settings menu- each numeric, date or category field displayed has a small black downward pointing arrow that reveals a Portal View filed display configuration menu with 3 options: Show value breakdown- displays selectable dynamic ranges of the values in the field. Each field displays up to five categories, ranges, or intervals as a default. Additional categories are grouped into a category named ‘Other’. Numerical fields are broken into intervals necessary to make five groups of records. The fields containing collapsed categories are underlined. Click on any underlined field title to expand that field and see all categories or smaller numerical intervals. Click again to collapse it again. Expand- expands the number of ranges displayed. If Show value breakdown is not selected, this option is greyed-out. Show statistics- displays a pick list of statistics available for each field (column). Tick those you want to display, with or without the value ranges:
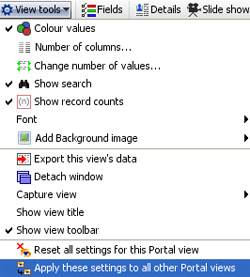
Portal View ToolbarThe Portal View tools drop-down menu features a number of options to configure the display. The Fields menu adjacent displays a pick and ordering list used to hide or show fields. Click and drag on the hands to change the order of the fields in the view.
Add background image- enables you to add a faded image to the backdrop of the view. Same as the option provided in other views and documented in the Page Menu commands. The other options on the Portal View Toolbar, Show Details, Slide show and Add to Basket are common to all views and documented in the section on View Toolbar. |