- Features by Edition
- Latest Features
- Licensing/Activation
- Installation
- Getting Started
- Data Sources
- Deployment/Publishing
- Server Topics
- Integration Topics
- Scaling/Performance
- Reference
- Specifications
- Video Tutorials and Reference
- Featured Videos
- Demos and screenshots
- Online Error Report
- Support
- Legal-Small Print
- Why Omniscope?
|
|
|
|||||
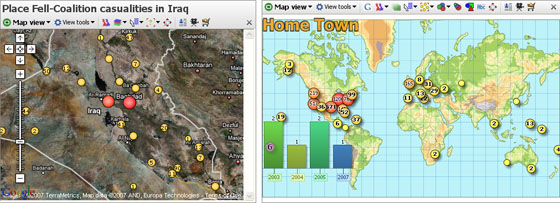
Map ViewUsing the Map ViewLocation, location and locationThe Map View is a powerful and flexible option for displaying spatial data at any level; world, country, city or even exhibition or office floor plans or sports playing fields. Omniscope embeds its own multi-layer vector maps that let you choose to display various geographic map layers (roads, mountains, sea depths, etc.). Omniscope comes with the world map shown below, but you can also download hundreds of other free country, regional and city maps from the Maps Library for embedding in your Omniscope files.
Using any activated edition of Omniscope, use the File > Open map > Download maps option to install and display new maps with blank data sets, which you can either ignore or start populating with your data. To load a scanned image or photograph for use as a backdrop, use the File > Open map > Browse for image or map file command. Note: Omniscope currently imports Image (.JPG, .BMP, .GIF, .PNG depending on your Java version) plus Visokio's own .VEC, .MAP and .ILF file formats for use as coordinate backdrops in the Map View. If you save an .IOK file containing embedded image map(s), Omniscope will bundle them into the .IOK file so that anyone with the free Viewer will see the file with the correct map(s). Each record (row) in your data sets can be associated with a marker displayed on the map, as long as the two designated map coordinate columns contain non-null, valid decimal coordinates. Using Place marker mode, you can add coordinates to your data set by opening a map view (or Google Maps), zooming in to show enough detail, then pointing at the location of each record with your mouse. More on Placing Markers... Details for each record are available by clicking on the marker representing the record or aggregated group of records. Note: if the Details view is not open, groups of four records or less will be displayed as a cascade of individual details windows, one per record, while markers aggregating five or more records will display the pop-up Show details table window showing the selected records with links to display individual details. Map View ToolbarThe Map View Toolbar includes the View Tools drop-down menu, an option to switch back and forth between vector and Google maps, a Map (Map Type for Google) selector, a Layer pick list, choice of mouse Mode and Zoom navigational controls, plus field (column) pick lists to set Colour, Sizing, Shape and Label options.
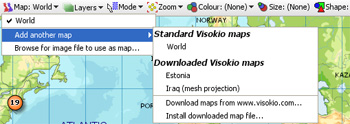
The Map View also features a pop-up Navigator overview mini-window, plus the Show Details, Slide Show, Add to Basket and [X] Close View options common to all views and documented here. Switch to Google/Vector Maps- to the right of the View Tools drop-down menu this option allows you to switch from the default vector map to a Google Map view which uses the same coordinate columns. When you are using Google Maps, this option label changes to Switch to Vector Map. Suggestion: Placing, moving and correcting coordinates using the mouse in Place Marker Mode using Google Maps works well. However, if you are manually editing, deleting or cutting and pasting coordinate data with an open Google Maps display, make sure that the Zoom setting is NOT Zoom to fit visible data. If you are scrubbing and filtering data and find your Google Map display updating slowly or not displaying properly, switching to the corresponding vector map, then switching back will usually restore the display in Google Maps. A tutorial on navigating in the Map View is available here. Map View Toolbar- Map selector for vector mapsThe Map selector is used to change the map in the view, or add a new vector map to the file. The drop-down menu shows the list of maps already configured in the file, with the currently displaying map ticked. Below that is the option to add another map from those already downloaded onto your machine, or by downloading additional maps from the Maps Library. If you select to add a new, unconfigured map to the file, the Configure Map wizard will appear (see above) so that you can define a title and specify the coordinate fields (columns) to be used with the new map.
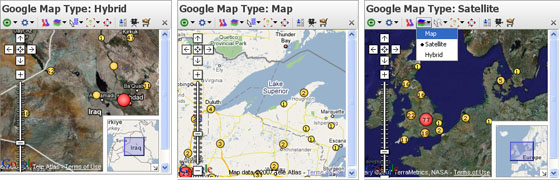
There is also an option to import your own map as an image in formats supported by your version of Java, plus Visokio Map formats (.VEC,.MAP,.ILF). Click on Browse for image file to use as a map, then browse to and select any image you choose. It will appear in the Map selector drop-down map listing menu as part of your growing collection. You can use any kind of photograph or scanned image as a Map View backdrop for placing data points. Typical examples include sporting fields, exhibition hall, office or factory floor plan layouts, banquet seating arrangements etc. Map View Toolbar- Map Type selector for Google MapsWhen displaying a Google Maps as a backdrop, the Map selector becomes Map Type, and allows you to chose from 3 options for the Google Map display: Map, Satellite and Hybrid:
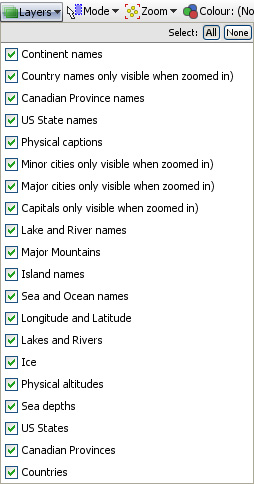
Choose one or more Google Map types that best suits the purpose of each display. Map View Toolbar- LayersThe default map is a Mercator projection world map with physical and political information in a series of configurable layers. With the default world map open, click ‘Layers’ to choose what to display. Click 'Physical' to hide or show physical altitudes and reveal the 'Political' layer. Tick or untick layers until you have the map you want.
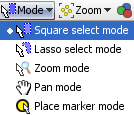
Note: some layers, such as capital, major and minor cities, will not be visible when zoomed out. Omniscope shows map detail progressively, only when the view is close enough to make sense of it. As you zoom in, more and more detail will appear, revealing the layers you have chosen. If you would like to develop your own layers for distribution in .IOK files for display on vector or Google Maps, please contact us.. Map View Toolbar- Mode selectorMap View selection Mode options are very similar to those used in the Graph View, including mouse-defined Square select and Lasso free-form selection as well as Zooming, and Panning navigational modes. The Mode options menu enables you to choose how to navigate and select points and groups of points on the display. You can define one or more selection areas/shapes in order to exclude or isolate records using
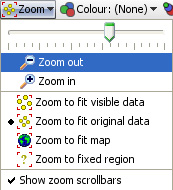
Place Marker mode- used to place markers for selected records, thereby generating values for the coordinate fields in the data. To do this, open a Table View and select a record with no coordinates/map marker by clicking the row header (or multiple records using the Shift or CTRL keys). Once selected. go to the open Map View, and with Mode set to Place marker mode, click on the point you want to locate the selected records on the map. In the case of the Visokio and Google world maps, the correct decimal longitude and latitude values will be placed in the coordinates columns. In the case of other maps, the coordinates will be relative to the specific map. For more detail, see Placing Markers. Map View Toolbar- Zoom selectorThe Map View Toolbar Zoom selector is also very similar to that used in the Graph View. The slider and Zoom out or Zoom in controls increase or reduce the magnification, changing the area and amount of detail/layers displayed.
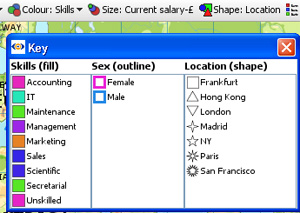
Show zoom scroll bars- when ticked, displays the zoom scroll bars bottom and sides at all times, even when zooming is not active. Map View Toolbar- Colour, Size and Shape menus (& Key)Marker Colour, Size and Shape options are all defined with field pick lists available under each of these Toolbar options. If any of these options (or the Marker outline colour by option available in Marker options-see above) are set, the Key display also appears to help the reader relate the appearance of each marker to the underlying data.
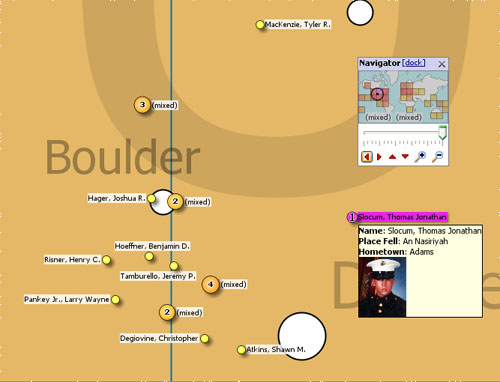
NOTE: You set the colour and shape associated with each different field (column) values using Data > Manage Fields available from the Main Toolbar. The intensity of the relative sizing effect is controlled with the Size and Range sliders in the Marker options Advanced menu (see above). Map View Toolbar- Labelling (vector maps only)The Label drop-down selector enables you to choose the field to display next to all unaggregated markers. Aggregated markers show the label (mixed) until zooming or selection results in disaggregation to a single record.
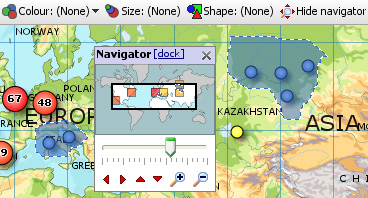
Labelling is displayed for all unaggregated records. Selecting a record can also trigger the display of Tooltips, which cam include associated images. Tooltips are configured for all views using Settings > Tooltips > Fields from the Main Toolbar. Map View Toolbar- Navigator mini-view windowClick the ‘Navigator’ button to show a small map navigation and view control window that can be placed anywhere on screen. Moving the zooming slider, or clicking the (+) Zoom in, or (-) Zoom out icons increases or decreases the magnification, which reduces or increases the coverage area shown in the thumbnail map framing window. Clicking the red vertical and horizontal arrows in the Navigator moves the small framing window around the thumbnail map. The thumbnail map in the Navigator shows a heat map of record density, and selected areas in blue. Click and drag the red thumbnail map framing window in to move around the main map.
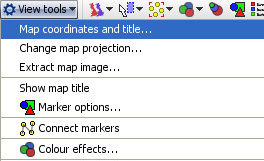
Map View ToolsThe Map View Tools drop-down menu provides options to define maps and control the display of markers.
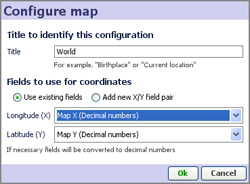
Map coordinates and title- displays the Configure Map dialog used to specify the title and coordinate fields (columns) to be used to place records on this particular map. With the correct map displayed in the view, select the fields to use as coordinates.
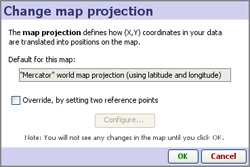
For more detail on map coordinate systems, and creating/transforming coordinate systems, see the Knowledge Base section on Maps & Coordinates. Change map projection- (not shown with Google Maps) used to create or refine coordinate systems for maps/backdrops that do not conform to the default Mercator projection decimal latitude and longitude system. This is most commonly the case with scanned images like floor plans, sports fields, some city and road maps, etc.
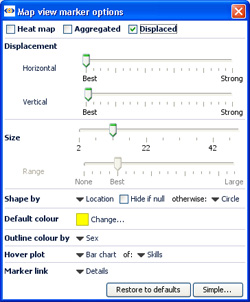
For more detail on using these 3 options to determine the display of your data on a given map or image, see the Knowledge Base section on Changing Projections. Extract map image- (not available with Google Maps) allows you to export a copy of the embedded vector map as an image file Show map title- (not available with Google Maps) when ticked, displays the map title(s) in the upper left the map, in orange font as shown in the examples at the top of the page. Marker options- clicking launches the Marker options dialog, very similar to that used in the Graph View. This dialog enables you to configure how markers on displayed on the maps/scanned images you are using as backdrops for your data.
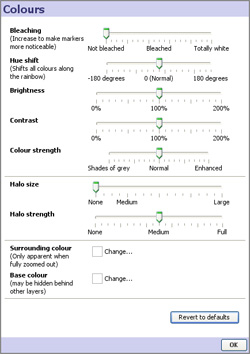
Displacement- (not available with Google Maps) changes the amount of displacement vertically and horizontally to improve access to data points for selection and linking. Connect markers- (not available with Google Maps) similar to the option available in the Graph View, opens and expandable sub-menu. Use of these options with the Map View is documented here. Colour Effects- (not available with Google Maps) launches an extensive menu of options to modify the display of the map/backdrop:
|