- Features by Edition
- Latest Features
- Licensing/Activation
- Installation
- Getting Started
- Data Sources
- Deployment/Publishing
- Server Topics
- Integration Topics
- Scaling/Performance
- Reference
- Specifications
- Video Tutorials and Reference
- Featured Videos
- Demos and screenshots
- Online Error Report
- Support
- Legal-Small Print
- Why Omniscope?
|
|
|
|||||
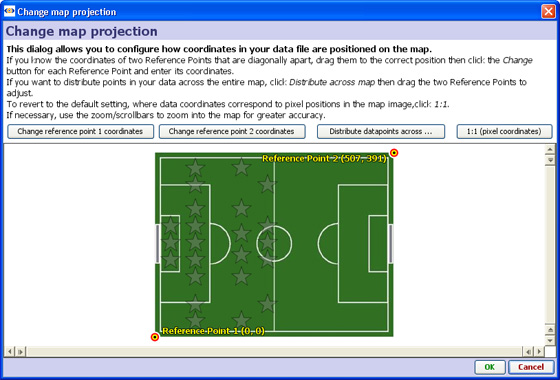
Changing ProjectionsChanging Image Map Projections - Generating Coordinate GridsUse any image as a map backgroundsMap projections define how the (X,Y) coordinates in your data set are displayed over imported images/maps used in the Map View. Omniscope allows you to calibrate or define coordinate grids on any kind of map, photo or scanned image imported for use as a map. For example, you can use an online mapping service to zoom into a specific area, then take a screenshot and use that image as a map background in your Omniscope file. Changing Image Map ProjectionsThe Omniscope Map View Toolbar View Tools menu (or the Configure Map View wizard in DataPlayer View) includes the command Change map projection. If your X,Y coordinate columns in your data set is consistent with the default projection for Omniscope maps (Mercator projections using decimal latitude and longitude coordinates as used by free services such as Google Maps/Earth), you will not need to use this command. However, if you are using a scanned image as a background map, or maps that are not consistent with the Mercator standard projection, you may need to tick the Override, by setting two reference points option. This dialog allows you to configure and refine how coordinates in the data file will be positioned on your map. There are 3 options: Option 1. You know the coordinates of specific points on the image - If, for example, you have imported a screenshot image of New York's streets (from Google Maps or other online zooming map service) and you have coordinates in your data set in some form of grid reference (such as latitude and longitude, which on a small scale are linear), and you know the coordinates of reference points, (say, two street intersections) that are diagonally apart (looked up in Google Earth, for example), you would use Change Reference Point Coordinates 1 and 2 to ensure points in your data set will plot in the correct location. Drag the two reference points on your image to where each of your reference crossroads are located, then click the Change Reference Point buttons to enter the correct coordinate locations for each crossroad. Option 2. You want the points distributed across the image- for example, you might have a data file of events during a game on a soccer pitch, and have imported a picture of the pitch to use as a map. You place corner events in two opposite corners of the pitch image. The coordinate system in your data file could be arbitrary, but assuming events happened across the entire pitch, you would click Distribute data points across map and the application would work out the transformation so as to "normalise" the points correctly. Option 3. You want the data points to map to the pixels in the image (default). To revert to the default setting, where data coordinates correspond to pixel positions in the image, click 1:1 (pixel coordinates).
|